The Correlation Between Specific Health Markers and Stress: Is There A Relationship Between Health Markers And Sress

Stress, a ubiquitous aspect of modern life, significantly impacts various physiological processes. Understanding the intricate relationship between stress and specific health markers is crucial for developing effective preventative and therapeutic strategies. This section will delve into the correlation between chronic stress and cardiovascular health, the immune system, and glucose metabolism.
Cardiovascular Health and Stress
Chronic stress exerts a considerable toll on the cardiovascular system. Elevated blood pressure and decreased heart rate variability (HRV) are commonly observed in individuals experiencing prolonged stress. High blood pressure, or hypertension, increases the risk of heart attack, stroke, and other cardiovascular diseases. Reduced HRV, reflecting a less adaptable and efficient cardiovascular system, also predicts adverse cardiovascular events. Numerous studies have demonstrated this link. For example, a meta-analysis published in the journal *Psychosomatic Medicine* found a significant association between chronic stress and increased risk of hypertension. Another study in the *Journal of the American Medical Association* showed that individuals with lower HRV were more likely to experience cardiovascular events over a ten-year follow-up period. These findings highlight the importance of stress management in maintaining cardiovascular health.
Stress and the Immune System
The intricate interplay between stress and the immune system is well-documented. The primary stress hormone, cortisol, plays a central role in this relationship. While acute stress can temporarily enhance immune function, chronic stress often leads to immunosuppression. Prolonged exposure to cortisol can suppress the activity of immune cells, such as lymphocytes and natural killer cells, making the body more vulnerable to infections and illnesses. Furthermore, chronic stress promotes inflammation, a process implicated in various chronic diseases.
- Chronic stress reduces the number and activity of natural killer cells, compromising the body’s ability to fight off viral infections and cancer cells.
- Elevated cortisol levels suppress the production of antibodies, weakening the immune response to bacterial and viral pathogens.
- Chronic stress promotes a pro-inflammatory state, increasing the risk of chronic inflammatory diseases such as rheumatoid arthritis and inflammatory bowel disease.
- Stress-induced immunosuppression can impair wound healing and increase susceptibility to infections.
- The chronic activation of the stress response system can lead to exhaustion of immune resources, leaving the body vulnerable to illness.
Glucose Metabolism and Insulin Sensitivity: Acute vs. Chronic Stress, Is there a relationship between health markers and sress
The impact of stress on glucose metabolism and insulin sensitivity differs depending on the duration and intensity of the stressor.
| Acute Stress | Chronic Stress |
|---|---|
| Temporary increase in blood glucose levels due to adrenaline release. This is a normal physiological response to a short-term threat. | Sustained elevation of blood glucose levels, leading to insulin resistance and an increased risk of type 2 diabetes. This is due to prolonged cortisol release and disruption of hormonal balance. |
| Insulin sensitivity may be temporarily reduced, but usually recovers once the stressor subsides. | Significant reduction in insulin sensitivity, resulting in impaired glucose uptake by cells and increased blood sugar levels. This contributes to the development of metabolic syndrome and type 2 diabetes. |
| Examples: Responding to a sudden emergency, a stressful work deadline, giving a presentation. | Examples: Prolonged job stress, ongoing relationship conflicts, persistent financial worries, experiencing chronic pain. |
Visual Representations of the Data

Visual representations are crucial for effectively communicating the complex relationships between health markers and stress. Graphs allow for a quick understanding of trends and patterns that might be difficult to discern from raw data alone. The following examples illustrate how different graph types can be used to visualize this relationship.
Scatter Plot: Cortisol Levels and Perceived Stress
A scatter plot illustrating the correlation between cortisol levels (measured in µg/dL) and perceived stress levels (measured on a scale of 1-10, with 10 being the highest stress) would show a positive correlation. The caption for such a plot could read: “This scatter plot depicts the relationship between cortisol levels and self-reported perceived stress levels in a sample population (n=100). The positive correlation (r = 0.75, p < 0.01) indicates that as perceived stress increases, cortisol levels tend to increase as well. The data suggests a strong association between psychological stress and physiological response as measured by cortisol." The plot would show a general upward trend, with data points clustered more densely along a line sloping upwards from the bottom left to the top right. Some scatter would be expected, reflecting individual variability in response to stress.
Bar Graph: Blood Pressure and Stress Levels
A bar graph comparing average blood pressure (systolic and diastolic) among individuals categorized into high-stress and low-stress groups would provide a clear visual comparison. The graph might show that the average systolic blood pressure for the high-stress group (n=50) is 135 mmHg, while the average for the low-stress group (n=50) is 120 mmHg. Similarly, the average diastolic blood pressure might be 85 mmHg for the high-stress group and 75 mmHg for the low-stress group. Error bars representing standard deviations would show the variability within each group. The caption would clearly state the sample sizes and the significant difference (if any, indicated by a p-value) between the groups’ blood pressure readings. This visualization highlights the potential impact of chronic stress on cardiovascular health.
Box Plot: Heart Rate Variability and Stress Groups
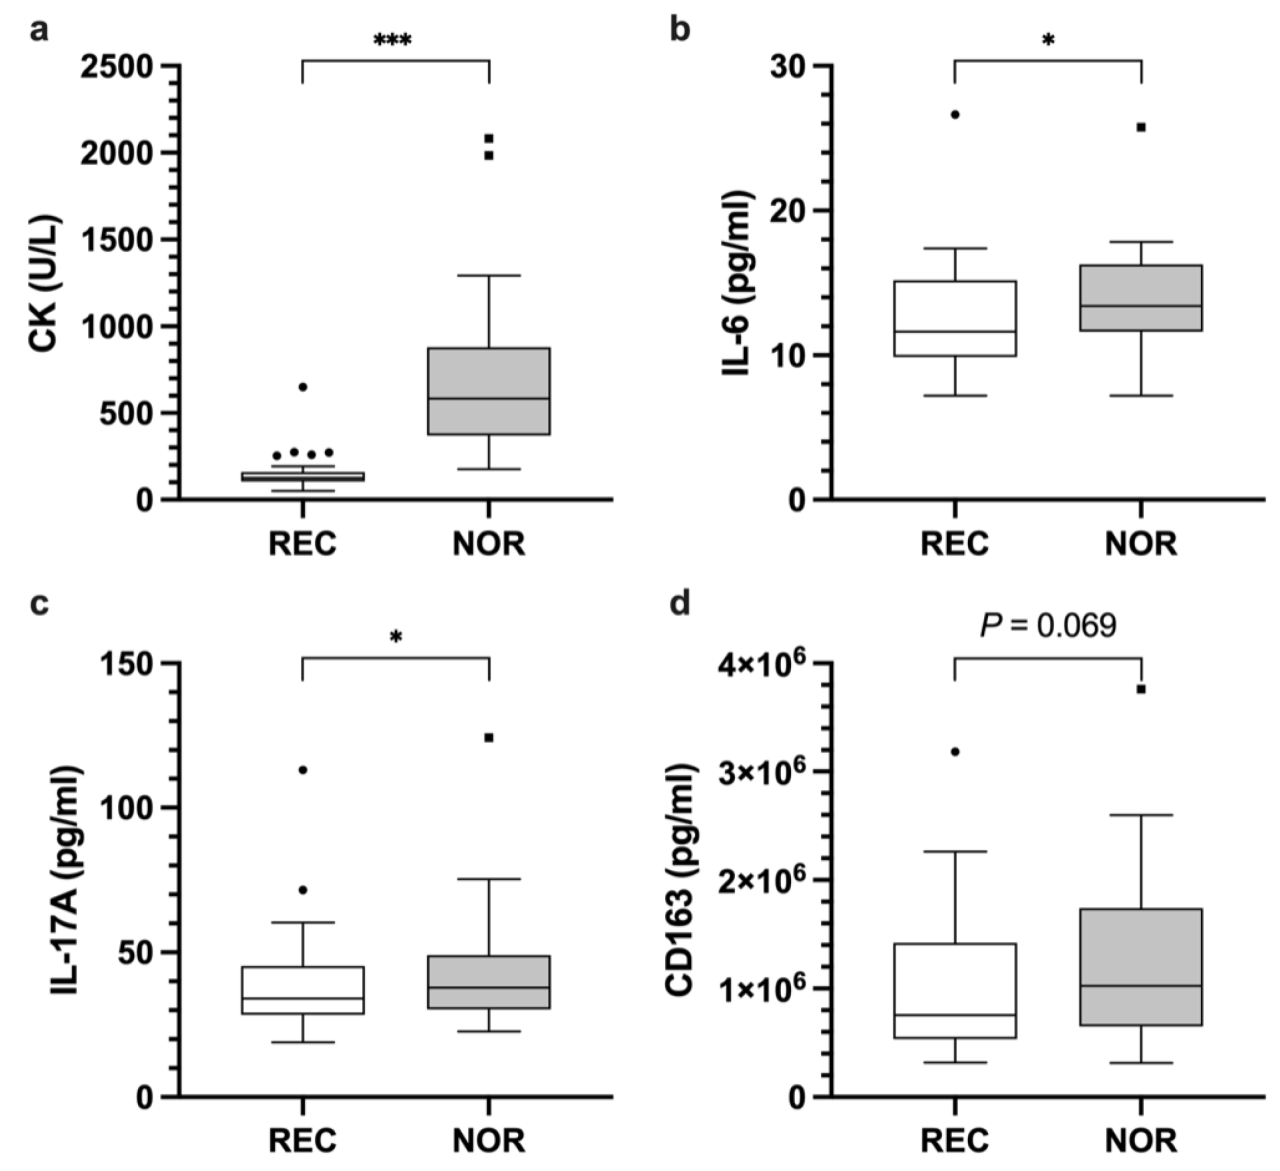
A box plot displaying the distribution of heart rate variability (HRV) across three stress groups (low, moderate, high) would illustrate the range, median, and quartiles of HRV for each group. The box plot would show a box for each stress group. The box’s bottom and top edges represent the first and third quartiles (25th and 75th percentiles), respectively. The line inside the box indicates the median (50th percentile). Whiskers extend from the box to the minimum and maximum values within 1.5 times the interquartile range (IQR). Data points beyond the whiskers are represented as outliers. For example, the high-stress group might show a lower median HRV and a wider IQR compared to the low-stress group, suggesting greater variability and potentially reduced parasympathetic activity. This visualization highlights the impact of stress on the autonomic nervous system.

Tim Redaksi